Enterprise Performance & Goal-Setting Dashboard for Financial Institutions
Transforming Decision-Making & Performance Tracking for Executives and Program Managers
80%
Reduction in Data Fragmentation
30%
Faster Decision Making
+100
Data Points Mapped
Overview
A prominent financial institution faced challenges with fragmented performance tracking, unclear goal-setting processes, and a lack of real-time insights for its clients, who were wealth management institutions. This affected their ability to monitor assets, revenue, operational efficiency, and compliance performance. The absence of an integrated dashboard hindered executives, program managers, and territory managers from effectively driving growth and optimizing operations.
Challenges
Lack of a centralized reporting system: Data was scattered across different tools, making it difficult to get a comprehensive overview of business performance.
Inefficient goal-setting workflows: Goal tracking was inconsistent, and stakeholders lacked a structured way to set, monitor, and adjust targets.
Limited operational visibility: Executives and managers couldn’t compare team performance effectively or identify operational inefficiencies in areas like advisor compliance, client retention, and sales performance.
Difficulty in managing asset and revenue growth: No clear unified tracking of Net New Assets (NNA), AUM trends, GDC, and advisor productivity across programs and territories.
The Approach
We applied Design Thinking and User-Centered (UC) processes to structure an enterprise-grade financial reporting and goal-setting tool.
1. Discovery Stage – Understanding the Needs
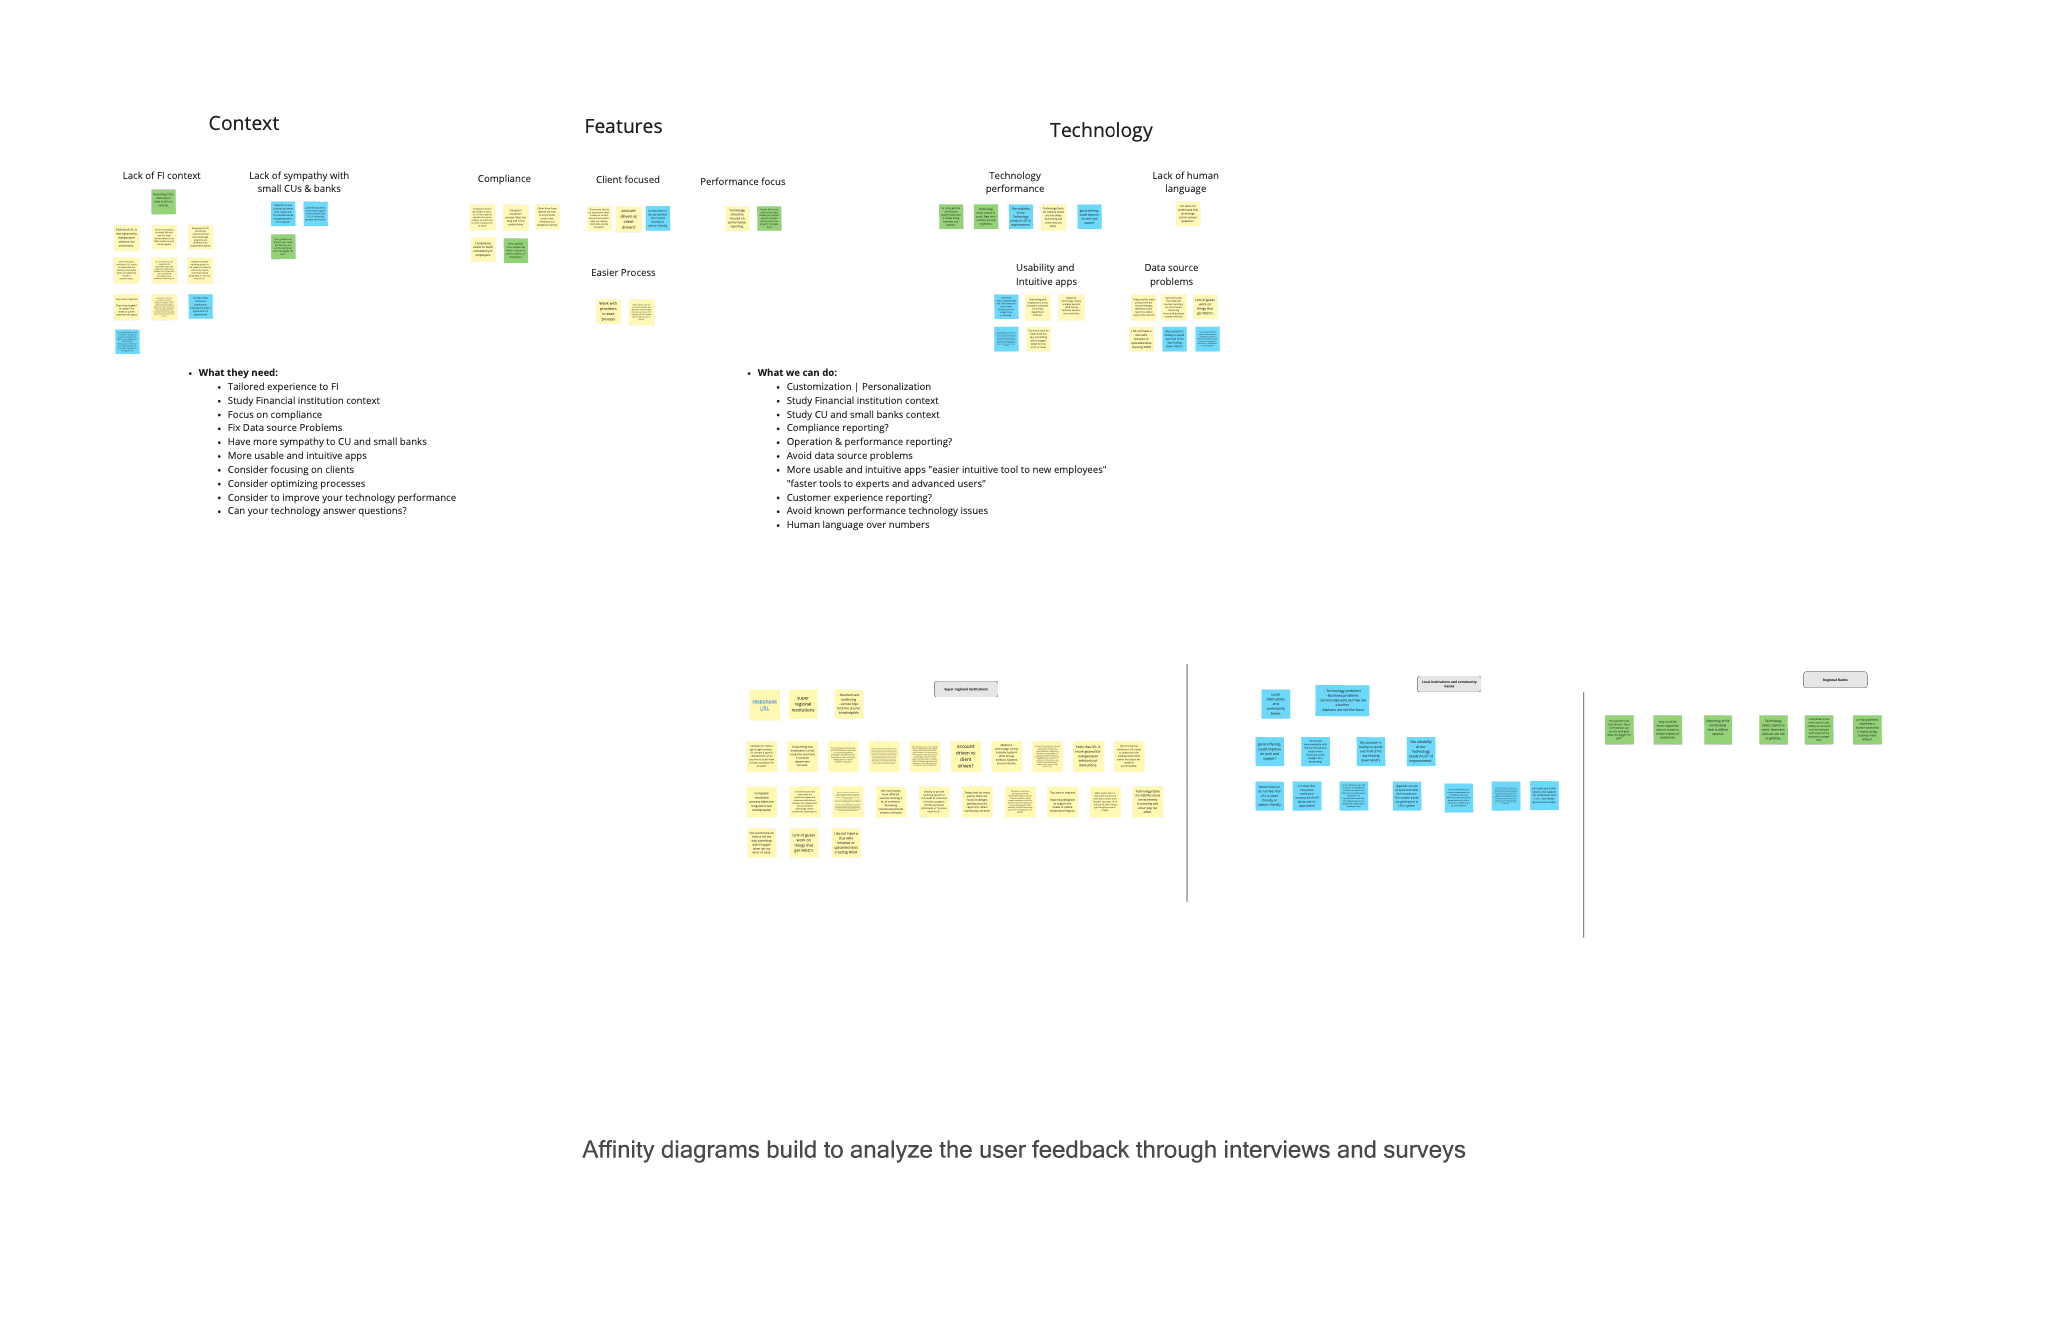
We started with in-depth user research to uncover key business pain points and technical challenges. This involved:
Stakeholder Interviews: Spoke with executives, program managers, and territory managers to identify their specific data tracking and decision-making needs.
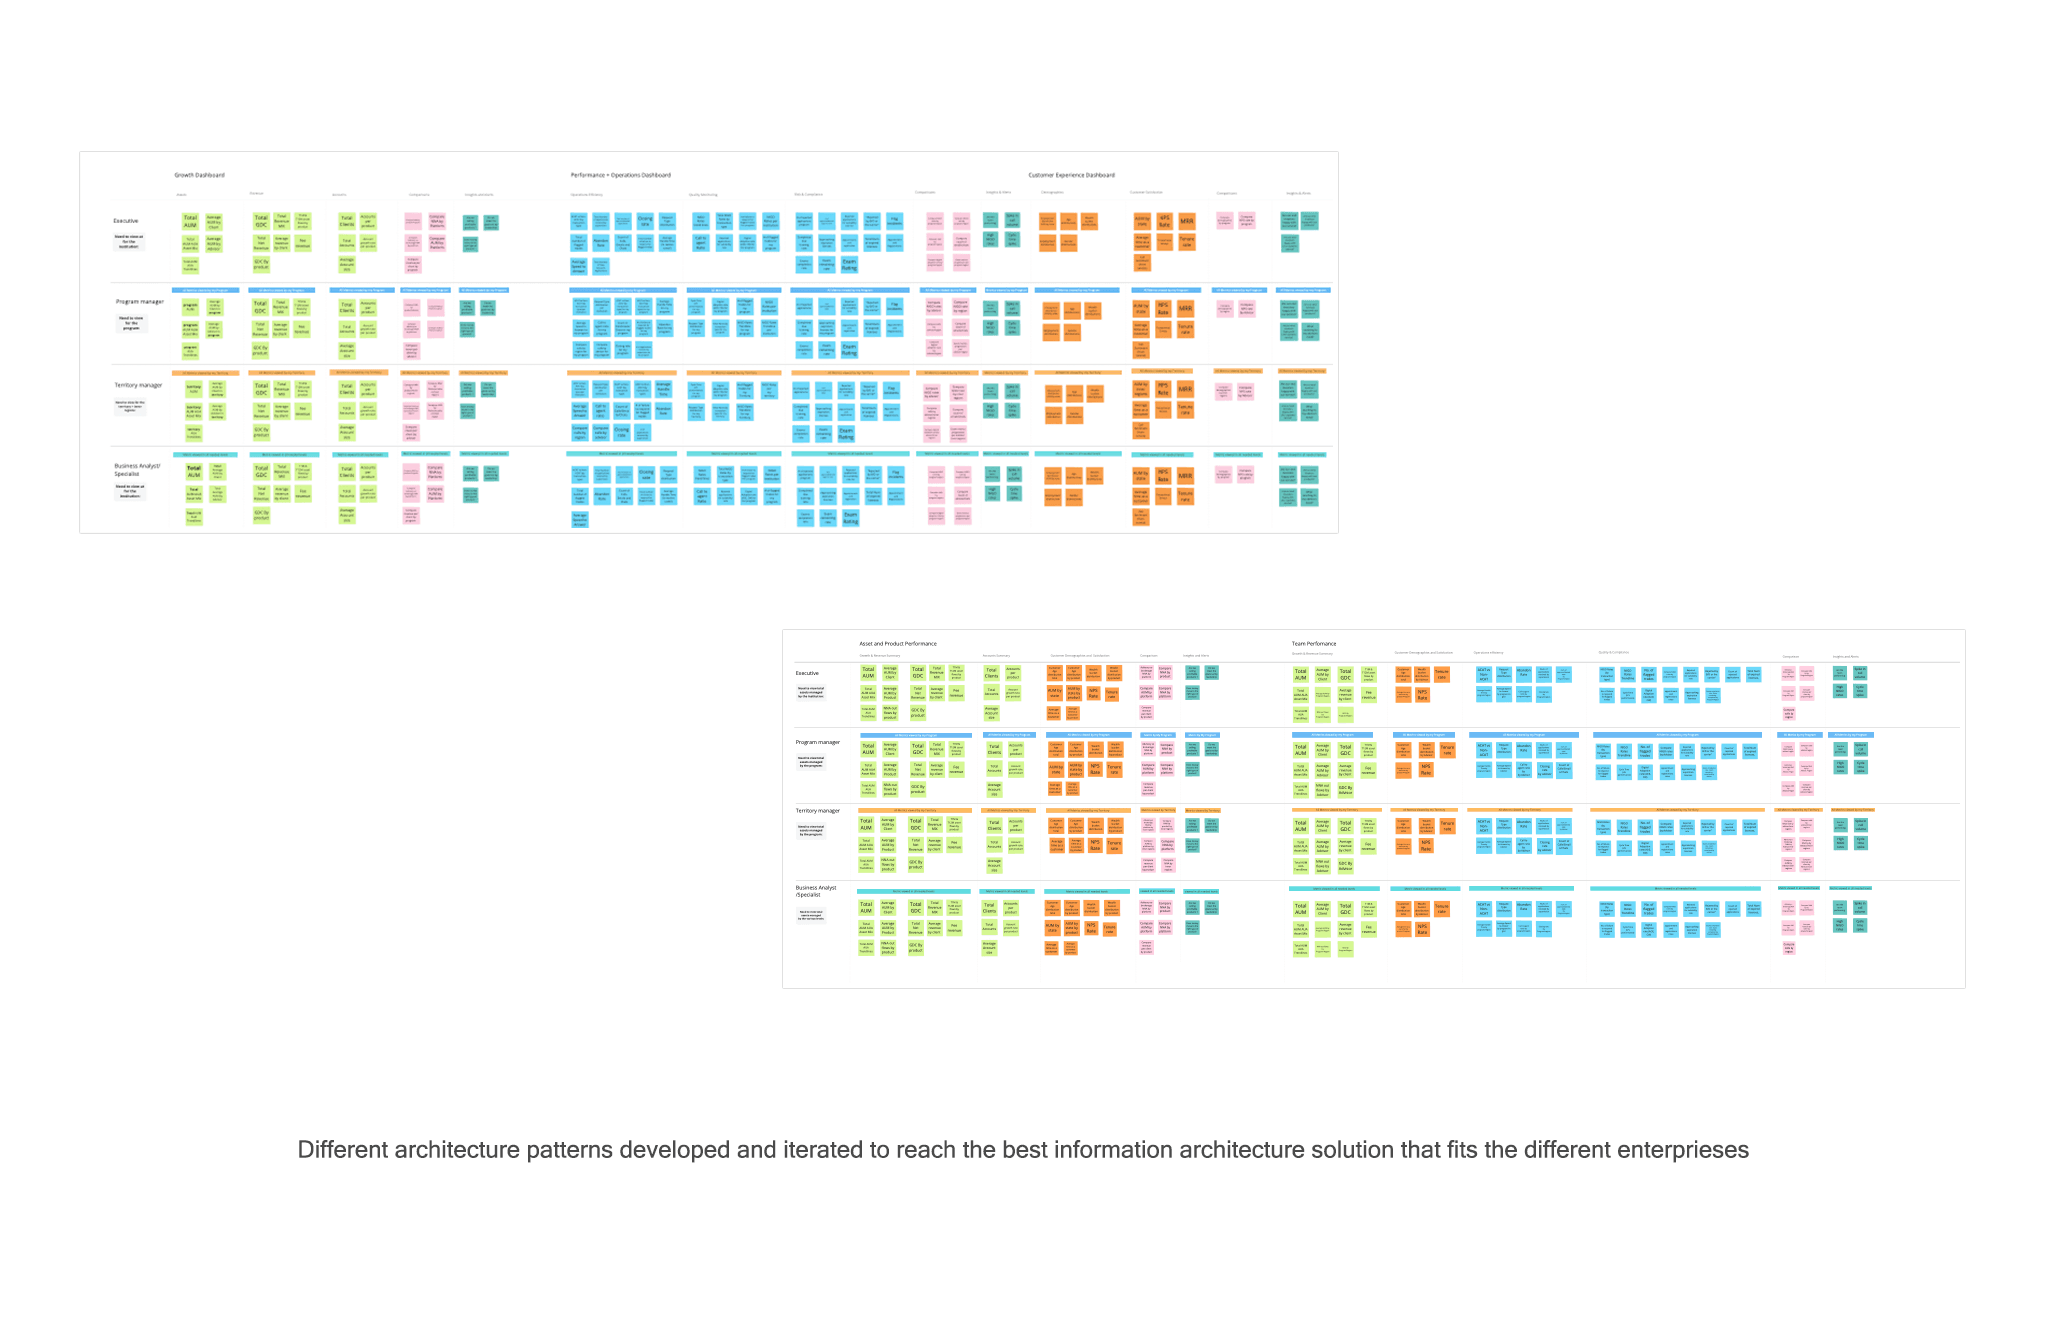
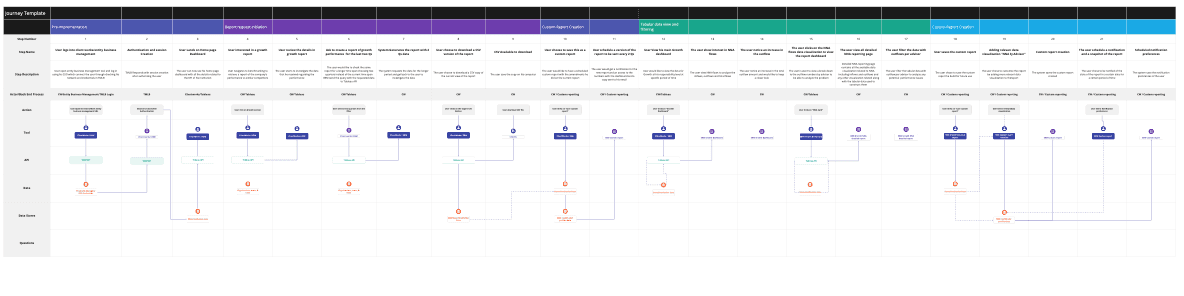
Use Case Mapping: Defined critical user workflows and interactions with the system by creating detailed use case maps. This helped visualize how different roles would interact with the financial reporting and goal-setting platform and ensured all functional needs were accounted for.
Competitive Benchmarking: Analyzed existing financial reporting platforms to identify gaps and best practices.
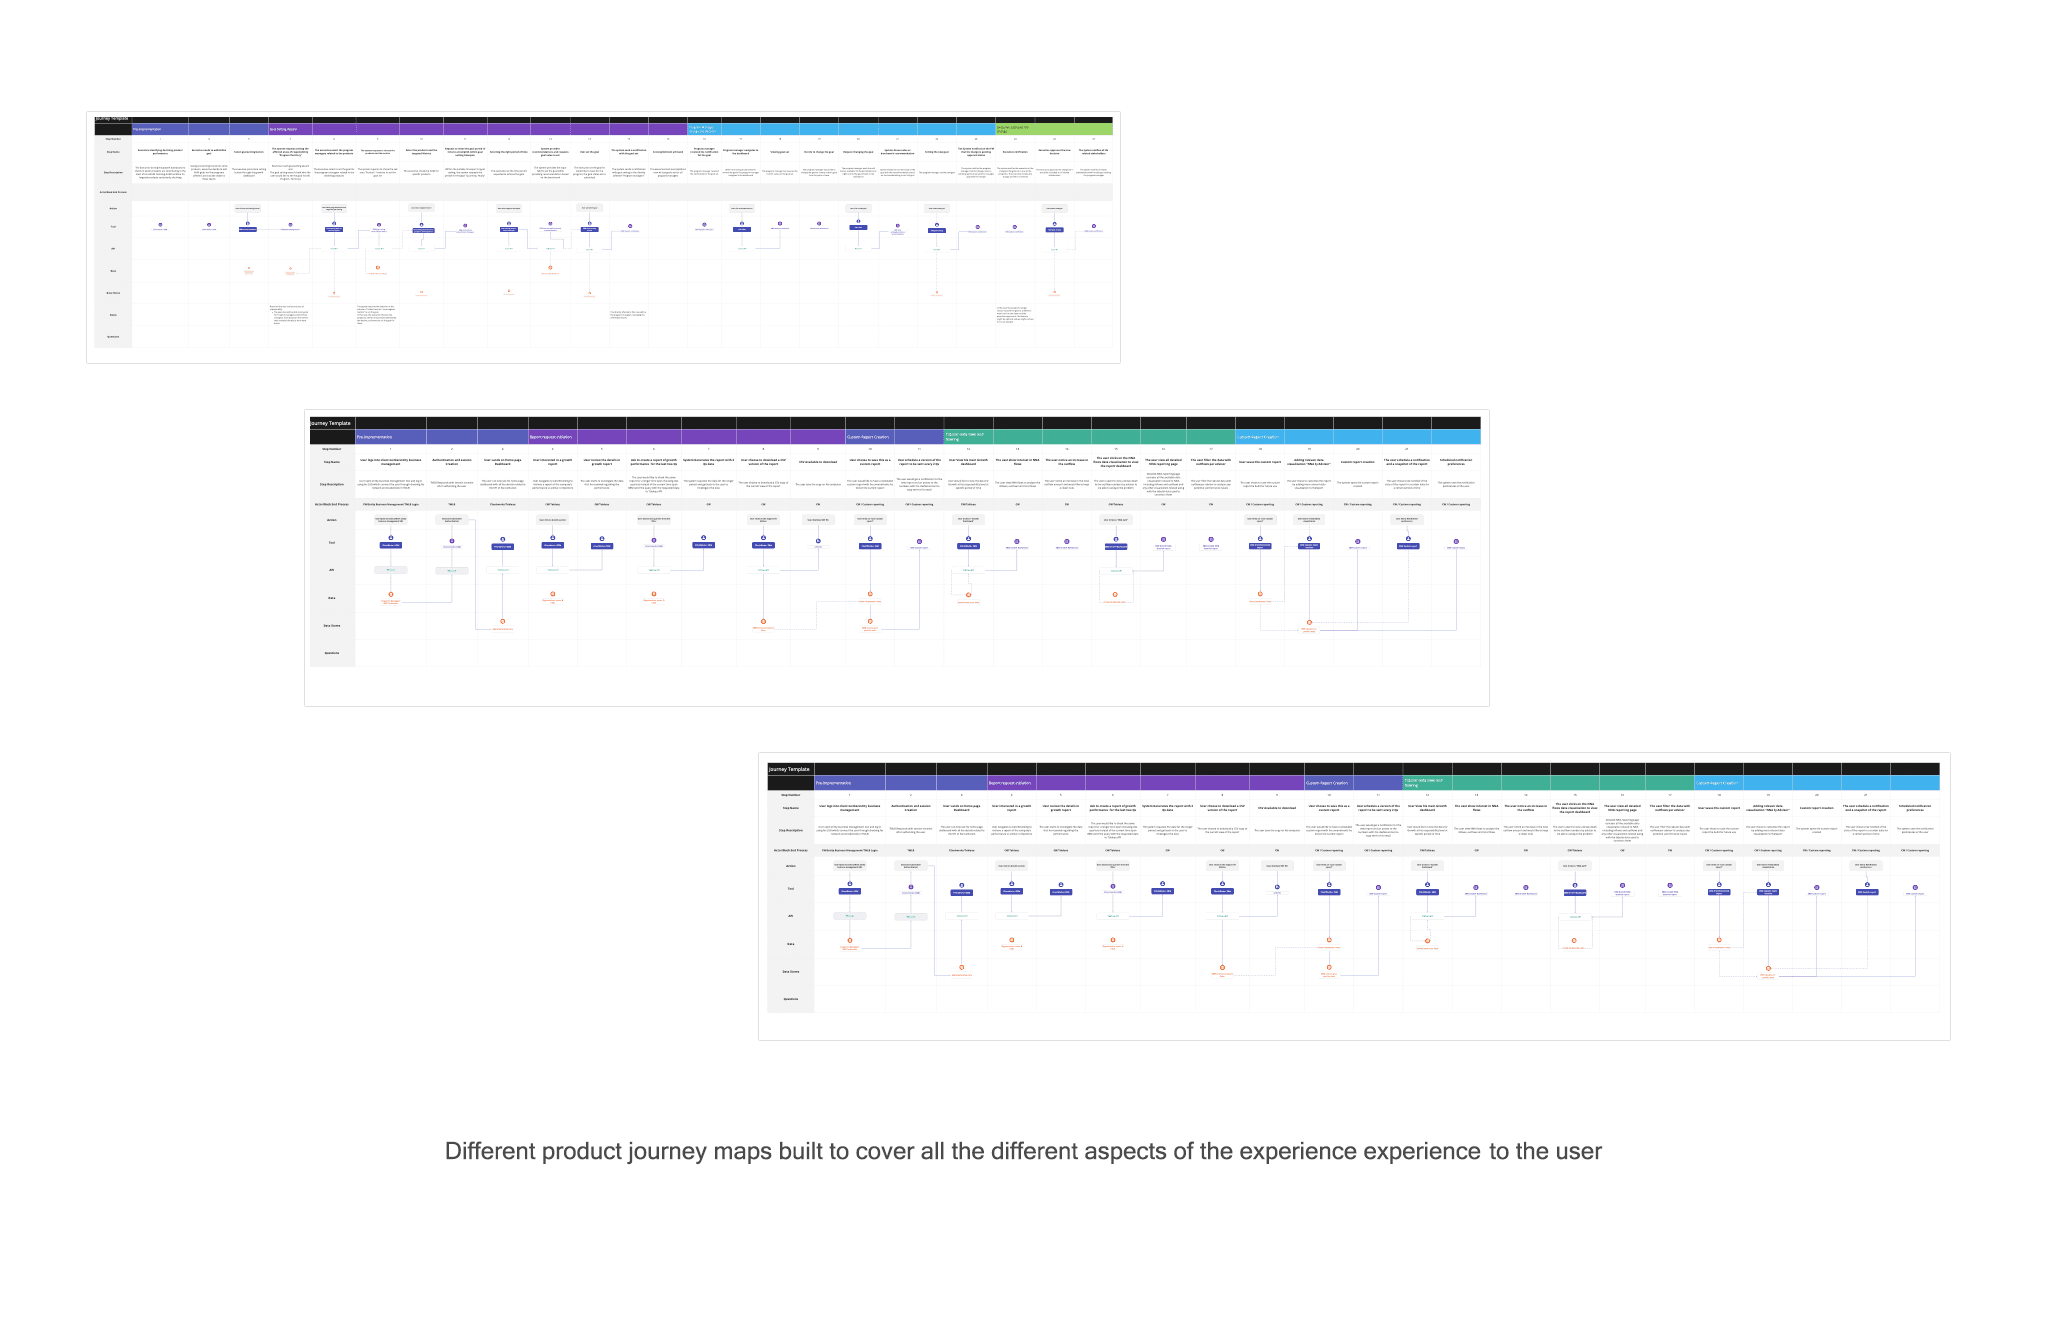
User Journey Mapping: Built journey maps to visualize how different roles interact with financial performance data and identify friction points.
2. Exploration Stage – Validating and Prototyping
To ensure a solution that truly aligns with business goals and user needs, we applied:
Heuristic Evaluations: Assessed usability flaws in existing tools.
Wireframing & Prototyping: Created low and high-fidelity prototypes to explore different dashboard structures and visualization techniques.
Reflection Sessions with Stakeholders: Conducted continuous feedback loops with executives, program managers, and key users to refine concepts.
Iterative & Reflection Sessions with Stakeholders: Conducted workshops and review sessions with executives, program managers, and advisors to refine concepts, ensuring that business requirements and operational realities were fully captured.
Usability Testing & Design Validation: Performed task-based usability testing to measure ease of navigation, data clarity, and reporting accuracy, incorporating user feedback to refine the final high-fidelity designs.
3. Solution Implementation
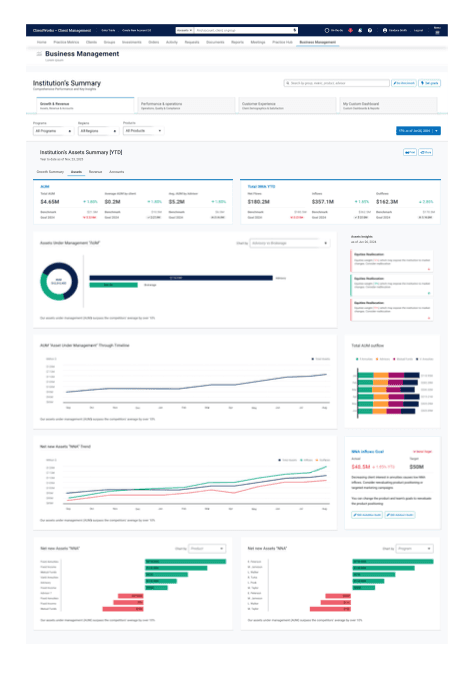
We developed a comprehensive enterprise dashboard that included:
Growth & Revenue Tracking – Real-time monitoring of AUM, NNA, revenue trends, and advisor performance across programs and regions.Performance & Operational Insights – Visualizing team efficiency, NIGO rates, ACAT processing times, and compliance trends to identify bottlenecks.
Customer Experience & Retention Metrics – Tracking client churn, demographic trends, and CSAT scores to enhance retention strategies.
Goal-Setting & Bulk Upload Feature – Built an intuitive workflow allowing executives to set, track, and adjust team goals at scale, streamlining strategic planning.